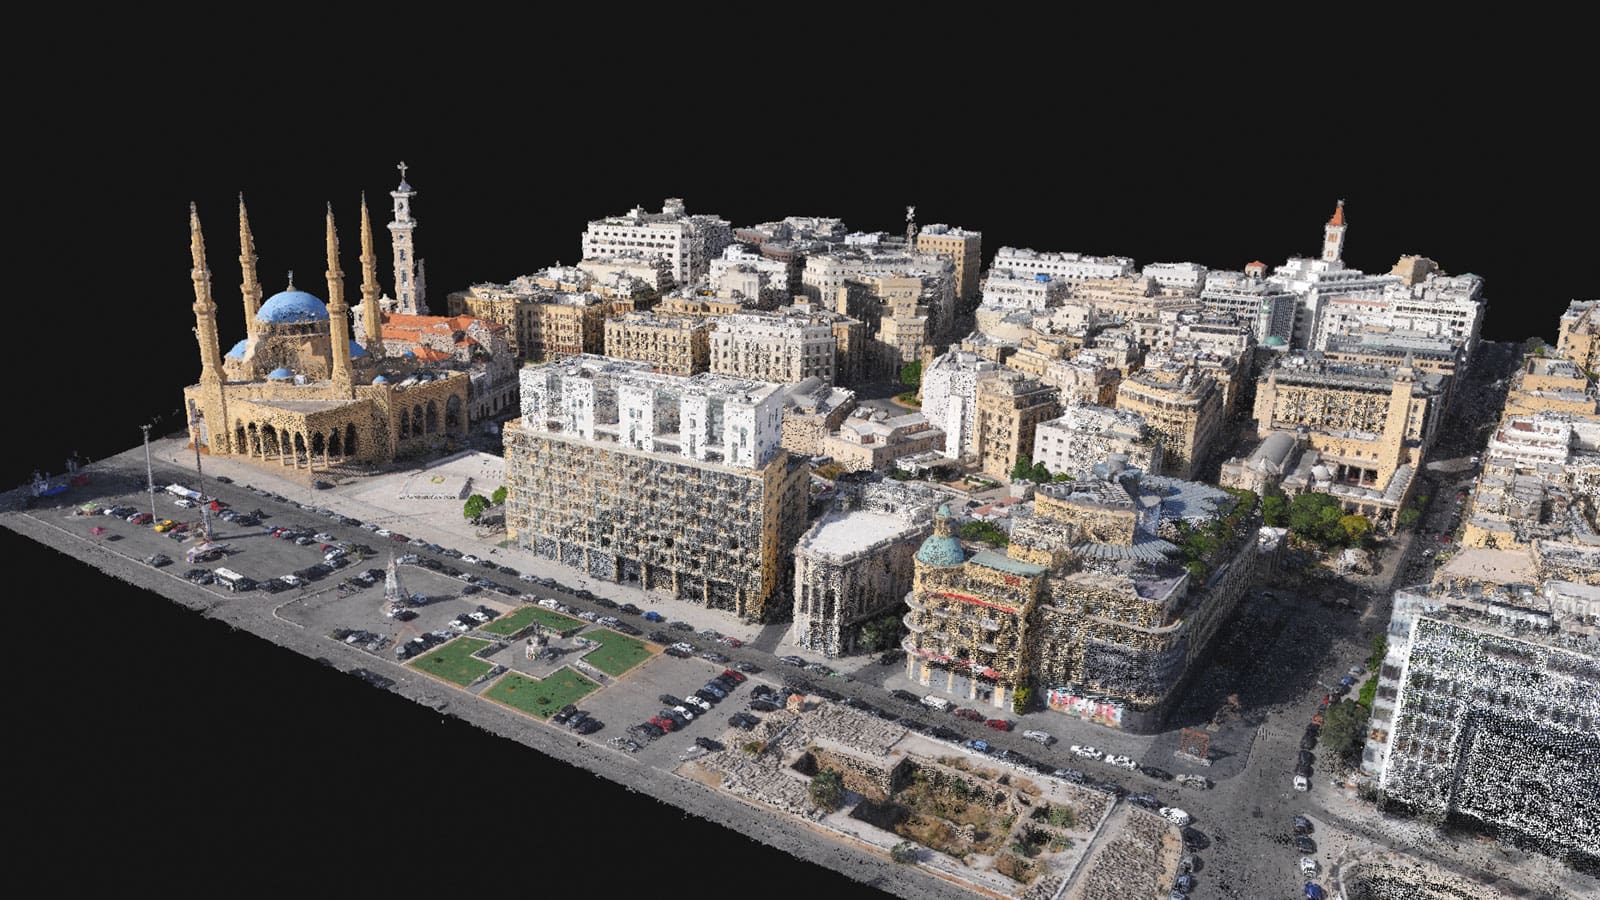
With city access difficult, an aerial map rapidly become the most realistic alternative and could be created more quickly than a terrestrially scanned map. An aerial map would also provide more information about the status of buildings and the ground around them. The plan took shape to use drones to gather images of the city, and then process the data with photogrammetry software that could merge the imagery to create a 3D point cloud and model that could be used to inspect the damage, make measurements, and determine where to begin with rebuilding.
What is photogrammetry? How does it work?
Photogrammetry is the science of measuring from images. It’s a science that has been around since the 1800s, although it has become significantly more advanced since then. Nowadays, one technique is to use images captured by drones and import them to specialised software. That software then processes the images, using image overlap to create a complete map that can be 2D (an orthomosaic) or 3D (a point cloud, or model) without missing gaps or distortion. It can be affected by light conditions, the quality of images captured, and the number of images captured.
Photogrammetry can also be affected by the drones used to collect images – rotary drones have propellors similar to a helicopter, meanwhile, a fixed-wing drone has two large wings like an airplane. Rotary drones can be more maneuverable and fly shorter distances, while fixed-wings fly for longer and higher. In addition, some fixed-wings have Real-Time Kinematic (RTK) or Post-Processing Kinematic (PPK), a method of ensuring high-accuracy geolocational data. That means images are tagged with their exact location, which can be used to get accurate measurements.
Finally, the camera quality has a direct impact on the results. Some of the most powerful cameras are capable of 20 Megapixel (MP) images – for reference, the latest smartphones have cameras of 12 MP. For a 3D model meant for emergency response and damage assessment, this is key to enhancing the value of the project – especially combined with PPK technology and powerful processing software.
Data collection in a crisis
Before the team could carry out any flights, the Lebanese government and military had to give permission to them to fly over the city. Due to the sensitive nature of the event, every rule had to be carefully followed. Only with official permission could the drone team take off.

A team was assisted by a drone’s company who provided a fixed-wing drone and specially trained pilots for the project. They used an eBee X drone with a S.O.D.A. 3D camera. The drone can fly for 90 minutes over an area of 500 acres (1235 acres) at an altitude of 400 feet. With the use of PPK to ensure geolocational accuracy, the drone can provide results with precision to within 3 centimeters (1.2 inches).
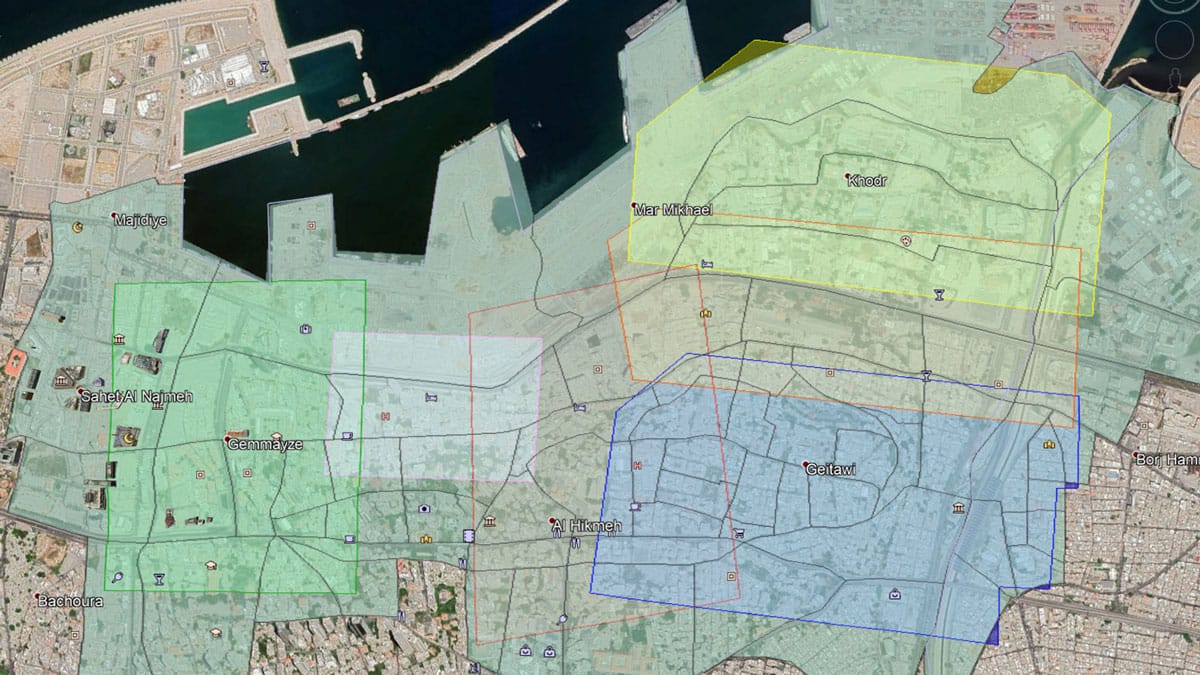
When the pilots flew, the camera on the drone was angled to be slightly oblique, which meant it could gather data to capture the facades of buildings as well as their surroundings. It took 6 separate flights to gather a total dataset of 13 GB. The overall area surveyed was 2.88 square kilometers over 4 hours.
Data was processed with desktop photogrammetry software used to crunch large datasets – in this case, it was 4,000 images.
The images had a resolution of 20 megapixels, perfect for getting in-depth analysis in a 3D model. The precision was ensured by PPK correcting the images after they were collected. Once the data was processed, it was shared using an online photogrammetry platform. This meant it could easily be accessed and used by different organisations. That fulfilled the overall aim of the project.
Using the 3D model for the future
Once the 3D model of the damaged area around the port was complete, it was shared with emergency responders in a large presentation. The impact was clear: a measurable, accurate replica of the city that anyone can use. The variety of applications it can be used for including blast modeling, emergency reconstruction, damage assessment, automated structural damage assessment, potential flood risk monitoring, urban planning, infrastructure impact and planning, multi-actor coordination, 3D layered information logging, and viewpoint analysis and calculation of potential roof use and rebuilding. It’s a model for not just now, but the future too. Anyone can download it due to being shared under a creative commons license.

The crisis and impact of the Beirut explosion cannot be understated. Hundreds of thousands of people were affected. However, it was by using modern technology and the cooperation of multiple organisations, that this team could help in the recovery impact. The drone response was fast, effective, and the use of photogrammetry provided a resource for anyone to use, whether they are an emergency responder or resident.
Links for the article:
- Pix4D website: https://www.pix4d.com
- Pix4D blog post about the explosion: https://www.pix4d.com/blog/beirut-disaster-response
- Augment 3D model and website: https://augment.lu/beirut-explosion
- Source for stats on the explosion: Human Rights Watch (https://www.hrw.org/report/2021/08/03/they-killed-us-inside/investigation-august-4-beirut-blast )
The opinions expressed are those of the author and do not necessarily represent the views of EENA. Articles do not represent an endorsement by EENA of any organisation.
